
Key Takeaways
- Bitcoin has risen by more than 10% over the past three days.
- Buy signals are starting to show up on the larger timeframes.
- As long as BTC can stay above $39,500, it could hit $46,350.
Bitcoin appears to be preparing for a bullish impulse as on-chain metrics show signs of increasing demand and little to no resistance ahead.
Bitcoin Has the Potential to Surge
Bitcoin has reclaimed a crucial support level and appears to have plenty of room to go up.
The flagship cryptocurrency has risen by more than 10% over the past three days, gaining more than 4,000 points in market value. The sudden price increase appears to be correlated with a spike in demand in the spot markets. On-chain analysts Willy Woo reported an uptick in buying pressure of $1.2 billion of BTC.
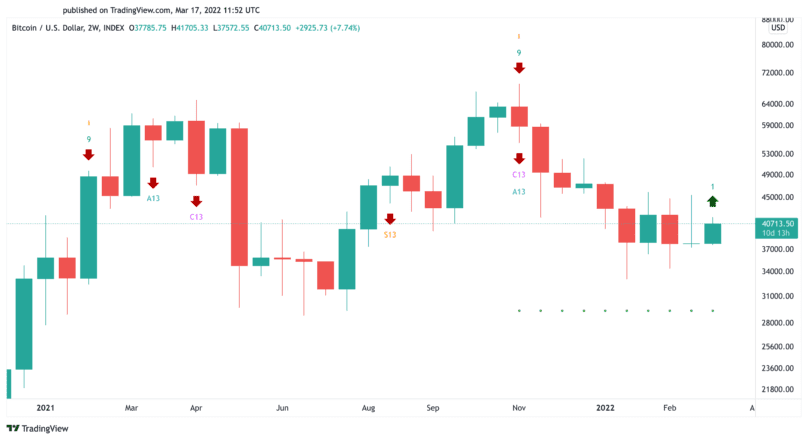
From a technical perspective, the Tom DeMark (TD) Sequential indicator presents a buy signal on Bitcoin’s bi-weekly chart. The bullish formation developed as a red nine candlestick. Further buying pressure could help validate the optimistic outlook, resulting in two to eight weeks of upside.
Transaction history shows that the pioneer cryptocurrency was able to claim a critical support level after the recent upswing.
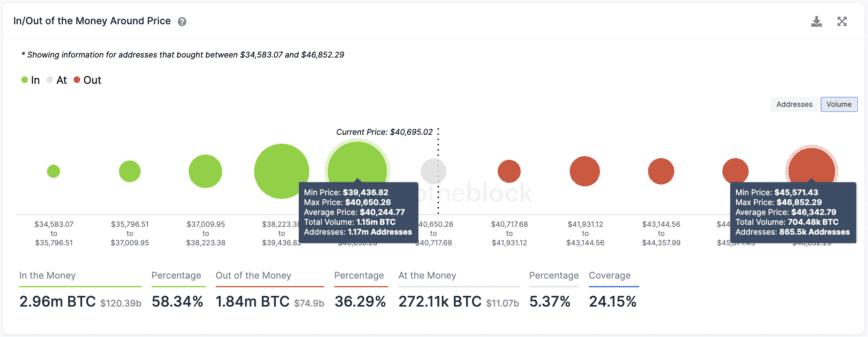
IntoTheBlock’s In/Out of the Money Around Price (IOMAP) model suggests that as long as Bitcoin continues trading above $39,500, it will have a chance to advance towards $46,350. This is the most significant resistance area ahead as more than 865,500 addresses had previously purchased nearly 705,000 BTC around this price level.
It is worth noting that the TD setup has accurately anticipated market tops and bottoms on Bitcoin’s bi-weekly chart. It was even able to forecast the November 2021 top, when BTC traded at an all-time high of nearly $69,000, which adds credence to the optimistic outlook.
Still, a decisive bi-weekly close below $39,500 could spell trouble for the bellwether cryptocurrency. Breaching such a critical area of support could send Bitcoin to $34,400, and if this level fails to hold, a capitulation event may occur.